What is meant by Financial Ratio Analysis?
We are often reminded of a mathematical concept, as soon as we hear about ratios. Financial ratios can be defined as the comparisons that are made by extracting values in the financial statements. Usually, it is difficult to pull out practical insights from the financial statements. Therefore, ratio analysis can be used to answer practical questions like: Does the business generate a sufficient profit for the investment? Does the business have liquid assets?. These financial ratios, which can be used to strengthen timely and accurate decisions, constantly hint about the changes that need to take for a better future.
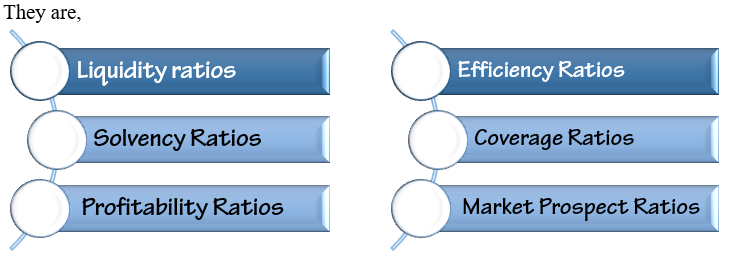
According to fintibi.com, the history of analysing financial statements goes back to the nineteenth century. Further, the changes in 1913 and 1914, especially with the establishment of the Federal Reserve System and the changes in the financial statements, have increased the need for ratio analysis. These financial ratios mainly focus on liquidity, solvency, profitability and the efficiency of the companies by going through the elements in the financial statements. Therefore, financial ratios can be classified into six types based on their concerns.
Further, different external and internal parties of organizations get the help of financial ratios to fulfil their various needs and expectations.

Liquidity Ratios
Liquidity Ratios measure the company’s capability of paying its short-term debts. It can be recognized as a key financial metric, as it implies whether the company is on the safe side or not. This generally means the company has enough liquid assets like cash, bank deposits to run the short-term business activities smoothly. The current ratio, quick ratio, and cash ratio are all examples of liquidity ratios.
1. Current ratio
The current ratio measures the company’s capability of paying its short-term debts with the use of current assets like cash, cash equivalents, stock etc. A high current ratio indicates that the company has an adequate amount of current assets to cover its debts. A ratio higher than 1 can be considered as a good current ratio and a current ratio less than one indicates that the current assets are insufficient compared to short-term debt obligations.

2. Quick ratio
The quick ratio measures the company’s capability of covering its short-term liabilities with the use of most liquid assets. This time you need to remove inventory and prepayments from current assets, as their liquidity is less than cash and other cash equivalents. A quick ratio of 1 can be considered as a typical ratio and a ratio less than one indicates a rise in issues related to paying debts, especially in terms of making payments to creditors.

3. Cash Ratio
The cash ratio measures the company’s capability of paying its short – term debts only using cash and cash equivalents. A cash ratio of one or higher can be considered as a highly preferable rate and a ratio below 0.5 is a sign of a red flag.

Solvency Ratios
The solvency ratio measures the company’s capability of meeting its long – term liabilities. This ratio provides a complete picture of the financial health of the company compared to its liabilities. Most importantly, it shows the ability to pay interest on long-term debts. The most common solvency ratios are as follows: debt-to-asset ratio, equity ratio, debt-to-equity ratio and interest ratio.
1. Debt-to-asset ratio
The debt-to-asset ratio measures the proportion of assets that are being financed with debt. It is calculated by making a comparison between short-term and long-term debts and the total assets of the company. A ratio of 0.5 or lower can be considered as a good debt-to-asset ratio as it indicates a healthy structure of finance. A ratio of one or higher indicates that the firm’s liabilities exceed its assets.

2. Equity ratio
Equity ratio measures the proportion of assets that are being financed with shareholders’ equity. According to Investopedia, shareholder’s equity consists of outstanding shares, additional paid-in capital, retained earnings, and treasury stock. This is calculated as a percentage and a result of 100% means that all assets have used equity as their source of funding. However, both debt and equity financing have their own pros and cons.

3. Debt-to-equity ratio
The debt-to-equity ratio is calculated by comparing total liabilities with shareholders’ equity. Maintaining a low-level liability compared to shareholders’ equity often leads to low risk. However, this ratio may vary from one sector to the other. Further, it shows the sufficiency of shareholder’s equity to pay off debt obligations in an event of a decline in business and economic activities. Further, a high debt-to-equity ratio means a large proportion of financing is consist of market borrowings.

4. Interest Coverage Ratio
The interest coverage ratio measures the capability of paying interest for outstanding debts with the use of earnings. Companies should maintain a minimum ratio of two to be in the safe zone and any number lesser than 1.5 implies a company’s inability or insufficiency in earnings.

Profitability Ratios
According to Investopedia, profitability financial metrics provide information about a company’s capability of earning profits in relation to its revenue, operating costs, balance sheet assets or equity. These financial ratios are mainly divided into two parts as margin and return ratios. Profit margin ratio, return on assets, return on invested capital and return on capital employed are some examples of profitability ratios.
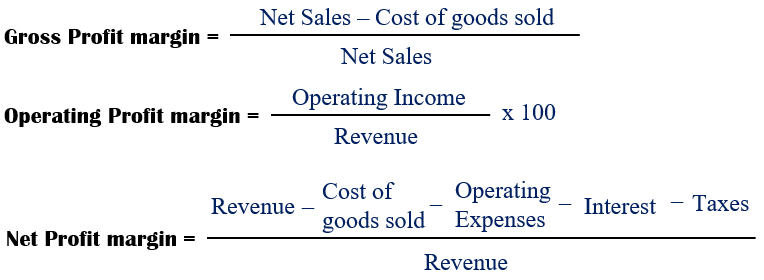
1. Profit margin ratio
Generally, profit margin ratio measures the proportion of profit made through sales. There are different types of profit margin ratios. Some of them are Gross profit margin, net profit margin and operating profit margin. Among these three ratios, the net profit ratio plays a key role as it is calculated after deducting all the expenses. However, Gross profit margin and net profit margins are calculated with the use of cost of goods sold and variable cost respectively.
2. Return on assets
The return on assets ratio measures the profitability of a company in comparison with the value of total assets. Usually, this ratio is calculated as a percentage and having a higher value can be considered as a good condition. This metric can be used to compare the asset utilization efficiency among different companies, which operate in the same industry. High percentages can be seen among the companies that utilize their assets efficiently to generate profits.

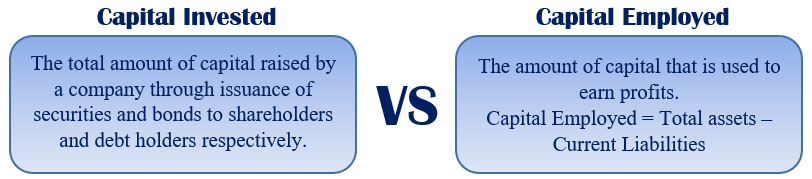
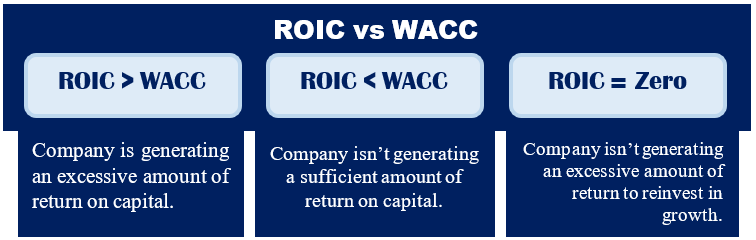
3. Return on Invested Capital
This financial ratio gauges the profitability of a company in comparison with the invested capital (includes both equity and debt). 2% or any number higher than the cost of capital is considered as a favourable condition for a company while a low number creates the worst scenario in an investor’s mind. Most importantly, it indicates that the company is not generating sufficient returns. Earning an insufficient amount of return can be recognized as a sign of an unhealthy business, which is backed by poor management.

4. Return on Capital Employed
This financial metric measures the profit earnings of the company in comparison with the capital employed. This also measures how efficiently capital has been used for the betterment of the entity. According to Investopedia, this ratio can be used to evaluate the performance of the industries that need a significant amount of investment for their operations. (Capital – incentive). Further, having a higher ratio can be identified as a favourable condition.